


How to show measurable, tangible AI improvements linked to Outcomes, KPIs, and OKRs

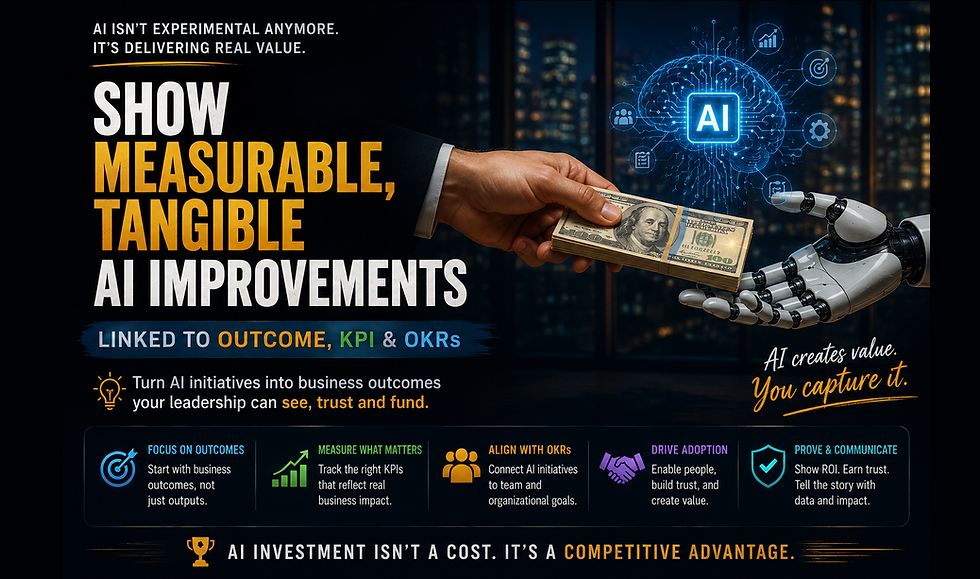
Summary: Demonstrating real AI value means tying each project to clear business outcomes and tracking them with rigor. This requires distinguishing between high‑level outcomes, specific KPIs, and broader OKRs; mapping each AI initiative to the right outcome; and picking measurable metrics (e.g. response time, conversion, error rates) for common AI use-cases (customer support, recommendation, fraud detection, process automation, demand forecasting).
We must establish baselines and use experiments (A/B tests, control groups or causal inference) to attribute impact correctly. Robust data collection and instrumentation are essential. Dashboards should report both outcome KPIs and operational diagnostics. Communication with stakeholders (via regular reports, governance boards and clear dashboards) builds trust and alignment. ROI should be calculated with all costs (TCO, training, human-in-the-loop) versus benefits (cost savings, revenue lift, time saved). Adoption and change management (training, center of excellence, leadership support) ensure the improvements are realized. Finally, consider tooling (open-source frameworks, MLOps/monitoring platforms, OKR software) and watch for legal/ethical risks (bias, privacy, transparency). We illustrate these principles with case studies (e.g. chatbots, fraud-detection, forecasting) that show before/after metrics. The article includes a frameworks/tools comparison table, OKR templates, and a pitfalls checklist.
Outcomes vs KPIs vs OKRs
An outcome is a high‑level result the business seeks (e.g. “reduce customer churn” or “improve system reliability”). A KPI is a measurable metric that tracks progress toward an outcome (e.g. churn rate, CPU latency, error rates). An OKR (Objectives and Key Results) combines a qualitative objective with 2–5 metrics (the key results). OKRs are goal‑setting frameworks meant to drive significant improvements over a time frame, whereas KPIs often reflect steady‑state performance. For example, an objective might be “Improve customer support efficiency” with KRs like “90% of tickets auto-resolved,” “reduce average response time by 30%”, etc. By definition, KPIs name an outcome as a metric – e.g. “30% reduction in claims-processing time” is a KPI because it specifies an outcome. In agile teams, OKRs align strategy (objectives) with concrete measures (KRs).
Key point: Always start by defining the business outcome in plain language, then pick metrics that capture it. For example, Atlassian emphasizes that OKR Objectives should be “memorable, qualitative” and Key Results are a set of metrics that measure progress. Likewise, a Scrum Master should articulate “what counts as success” before looking at dashboards.
Mapping AI Initiatives to Outcomes
Every AI project must tie back to a strategic outcome. For instance: an NLP chatbot might serve the outcome “better customer support” (with KPIs like resolution time, CSAT); a recommendation engine maps to “increase sales per user” (KPI: average order value or conversion rate). Map each use-case to at most a few outcomes or objectives. The mapping process should ask: What needs to happen for this outcome? Only then pick metrics. A common mistake is measuring activity, not value – for example, tracking “model runs” says nothing about revenue or cost impact. Instead, link the AI feature (e.g. deflecting chats with a bot) to business value (e.g. 20% fewer support agents needed) and measure that downstream effect.
In practice, align AI projects with existing OKRs or KPIs in the organization. For example, if an OKR is “Improve customer satisfaction by 10%,” an AI project might target that through faster support. Or if an outcome is “Reduce fraud losses by $X,” then an AI fraud‑detection model should report losses prevented. Confirm these connections with stakeholders and finance early so everyone agrees on what counts as success. This is part of governance – defining in writing the baseline, scope, and attribution plan before deployment. (Later we discuss attribution methods to ensure the AI’s effect isn’t overstated.)

diagram: Process flow for linking AI projects to outcomes through KPIs and OKRs.
Selecting Measurable KPIs/OKRs for AI Use Cases
AI can be applied in many domains, but to prove impact we must pick metrics that business leaders care about. Here are examples for common cases:
Customer Support / Chatbots: KPIs include average handle time (AHT), first-contact resolution, customer satisfaction (CSAT), number of tickets resolved per hour, and support cost per ticket. For a chatbot, track how many tickets it handles vs. before. For instance, a leading financial firm using IBM Watson Assistant saw customer interactions handled 24/7, reducing support costs, yielding a 337% ROI. (That Forrester study reported ~$23.9M in benefits over 3 years from chatbots in insurance.) Also consider adoption metrics like % of users trying the bot.
Recommendation Engines: Metrics are often business outcomes like conversion rate, click-through rate (CTR), average order value (AOV), and customer lifetime value (LTV). For example, research shows personalization (often via AI) can lift revenues 5–15% and marketing ROI 10–30%. E‑commerce OKRs could aim for “10% increase in conversion” with a KR measuring CTR on recommended items. Always include a revenue-oriented metric, not just engagement; e.g. uplift in sales per session.
Fraud Detection / Compliance: KPIs include fraud catch rate, false positive rate, losses prevented, and time to detect fraud. As a case study, a global bank’s AI system for check fraud cut fraudulent transactions by 50% and saved about $20M in annual losses. That shows outcome KPIs (fraud transactions, $ losses) moving significantly. Other useful metrics: % of alerts reviewed by humans, and manual review time. These connect directly to cost savings (less loss, fewer staff-hours spent on investigations).
Automation (RPA/Process): Metrics include cycle time (time per transaction), throughput rate, errors/defects, and hours or FTEs saved. For example, if AI automates data entry, measure how long a process took before vs. after (leading to “cycle time compression”). Compressing cycle time essentially adds capacity without new hires, often triggering gains in customer satisfaction and reduced churn. Turn time improvement (e.g. loan approval time) and units processed per employee are good KPIs. Always translate time saved into dollars (hours freed × loaded cost) for ROI discussions.
Forecasting & Planning: KPIs are forecast accuracy (e.g. mean absolute percentage error), stockouts prevented, inventory turnover, and plan vs actual variance. AI-driven forecasting can cut forecast error 20–50% and reduce lost sales/unavailability up to 65%. For example, McKinsey found AI in supply-chain forecasting reduced errors by 20–50%, translating to far fewer lost sales. A telecom call center case saw ~10% better volume forecasts, cutting costs 10–15% and improving service by 5–10%. In retail, a goal might be “forecast accuracy > X%,” with a KR measuring error reduction. Also measure inventory levels and service rate.
Summary: Pick a primary KPI for each AI project that directly ties to an outcome (e.g. revenue, cost, time). Supplement with secondary KPIs (adoption, quality) to diagnose performance. OKRs can bundle them: e.g. Objective: “Enhance Support Efficiency”, KRs: “Average resolution time ≤ 4 hours”, “CSAT ≥ 90%”, “Ticket deflection via AI ≥ 30%”.
Baseline Measurement, A/B Testing, and Attribution
A sound measurement starts with the baseline (pre-AI) and a plan for rigorous comparison. Common methods:
A/B Testing / Control Groups: Divide users or data into a test group (with AI) and control group (without). For example, show the AI-based recommendation to 50% of traffic and compare sales lift against the other 50%. For chatbots, randomly release bot access to some agents or time periods. Ensure groups are comparable. This controls for external factors.
Interrupted Time Series / Before-After: If a controlled experiment isn’t possible, measure the KPI trend before and after AI deployment. For instance, track “weekly fraud losses” over several months pre- and post-AI model. Use statistical tests (or tools like Google’s Causal Impact or difference-in-differences) to infer whether changes are significant.
Multivariate & Causal Inference: In complex settings, multiple factors change at once. Causal inference methods (propensity matching, regression with controls) can help isolate the AI’s effect. Always document other initiatives running concurrently (e.g. process improvements) and be conservative attributing gains to AI. One guidance: do not rely on user claims (e.g. “Yes I resolved issues faster”) without backing metrics. Track objective data on outcomes.
Attribution: Clearly define what counts as impact. For example, if an AI is used in a process, track whether that process’s cost or throughput changed. Avoid double-counting: improvements might stem partly from user learning or other tech changes. Lets keep in mind that overlooking the total cost (infrastructure, training, retraining) is a common pitfall. Likewise, counting only saved hours without discounting the full investment yields inflated ROI.
Always set the baseline and targets before deployment. Without a pre-AI reference, results are just anecdotes. Once data is collected, use rolling charts or dashboards to compare against the baseline (see next section).
Data Requirements and Instrumentation
Reliable measurement demands good data pipelines. Key steps: instrument your systems to log every relevant event. For example:
Tag and Log Inputs/Outputs: Log when the AI system is invoked, with identifiers. Capture the output, user identifiers (if permitted), and a timestamp. This could be chat transcripts, recommended item clicked, flag triggered for fraud, etc.
Link to Business Systems: Ensure the AI outputs tie to business records. For instance, if a chatbot resolves a ticket, log in CRM that the ticket closed due to the bot. For a recommended purchase, link AI suggestion logs with actual sales data. Without integration, you can’t measure ROI.
Quality and Feedback: Record when humans intervene or correct AI, and whether outcomes are correct. Track “hallucination” or error rates for GenAI models. For customer satisfaction, link AI use to CSAT surveys or Net Promoter Score.
Adoption and Usage Tracking: Use tools or custom logging to measure who uses the AI and how often. For internal AI tools (like co-pilots), track daily active users, session lengths, feature usage depth. These operational metrics help understand adoption (the “S” in AFAIR – success=adoption × value per use).
Data accuracy and timeliness are crucial. If your metrics are delayed or incomplete, decision-makers will lose trust. Automate data flows into analytics platforms (BI or data warehouses) to enable real-time dashboards. Ensure data privacy/compliance (e.g. anonymization) especially if tracking individuals.
Dashboards and Reporting Templates
Build dashboards that tier information for different audiences:
Executive / Outcome Dashboard (Board View): Show 1–3 Outcome KPIs (the highest-level metrics leaders care about) and key trending signals. For example, “Fraud losses (monthly)” or “Sales conversion rate”, plotted over time, with a clear baseline and target. Next to each chart, show status (on/off track) and variance. Keep it sparse – no more than a handful of KPIs per AI initiative. The agility-at-scale framework suggests giving executives just direct metrics of realized value, adoption, and risk, with drill-down links to detail.
Operational Dashboard (Team/Analyst View): Include both the outcome KPI and intermediate metrics (often called leading/lagging indicators). For a chatbot, this might include ticket volume, bot accuracy, fallback rate (how often human help was needed), and CSAT. For an AI classifier, show precision/recall charts, latency, throughput, etc. There can be a two-layer design: executives see high-level metrics, engineers see the diagnostic metrics underneath.
Reporting Cadence: Update dashboards frequently (daily or real-time if possible) for operational signals; formally review AI outcomes quarterly or monthly. Version-control all dashboards to track changes. Some teams build OKR tracking boards (in Jira Align, Azure DevOps, Gtmhub, etc.) that automatically pull data. Most people suggest tracking adoption and ROI by business unit – this could be a periodic report for leadership.
Include visuals (charts, bullet lists) and written summaries. A sample reporting template might list: objective, metric definitions, baseline value, current value, and comments on drivers. Use tables for complex comparisons (see below).
Stakeholder Communication and Governance
Clear communication and governance are vital to sustain AI initiatives. Key practices:
Cross-Functional Governance: Form an AI steering committee or CoE with business leaders, data scientists, IT, and legal. Define roles (data steward, product owner, etc.) and review AI projects regularly. Governance ensures that metrics stay aligned with strategy and risk policies (especially fairness and privacy). The Xebia framework emphasizes aligning leadership, data teams and business units around AI goals.
Regular Updates: Report progress to stakeholders using the dashboards, highlighting both successes and challenges. Call out any changes in assumptions. Build trust with transparency: explain what the AI is doing and why, in plain language. For example, if the model fails on certain edge cases, communicate that along with plans to fix it. Clear communication reduces resistance.
Explainability and Documentation: Maintain documentation of the model’s purpose, metrics, and limitations. For critical systems, hold explainability sessions. In regulated domains (finance, healthcare), provide evidence that you monitor bias/fairness (see below).
Ethics & Risk: In stakeholder meetings, include sections on risk monitoring: e.g. “Model drift,” “Fairness audits,” “Privacy compliance.” According to IBM, AI change management should prioritize trust (showing employees how AI helps them, with clear KPIs and ethics training) and transparency (explaining objectives and impact).
Governance Model: Decide which metrics go to which level. Managers may need detailed KPIs, but board members should see aggregated OKRs and ROI figures. Tie each metric to an owner responsible for action (e.g. “Product Manager will act if accuracy < X”).
In summary, communicate often and in business terms. Educate stakeholders on why the chosen KPIs matter. Solve doubts early. A long-term newsletter or dashboard notification can keep adoption high.
Cost/Benefit and ROI Calculation
To quantify ROI, list all costs versus all benefits over a period (usually 1–3 years), then compute ROI or payback. Components include:
Costs: Development costs (staff, compute), software licenses, infrastructure (cloud/GPU), data engineering, integration work, maintenance, and total cost of ownership (including re-training cycles and human review). Don’t overlook indirect costs like reduced headcount over time (which may be a benefit, but initial severance is a cost), and any one-time consulting fees.
Benefits: Reduced labor costs (hours saved × fully-loaded wage), increased revenue, reduced error costs, or any hard savings. Translate technical improvements to P&L: e.g. if an automated process cuts 1000 hours of work, multiply by rate. Take an example: “We saved 400 hours; thus freed $28,000 in labor capacity”. Also count avoided costs (like losses prevented in fraud case).
ROI Formula: ROI = (Net Benefits – Net Costs) / Net Costs. Or compute NPV/IRR with discounted cash flows for multi-year. But as agility-at-scale notes, AI value usually compounds, so simple NPV can misstate early vs late value. One approach is a multi-tier ROI:
Trending ROI: show directional metrics now (adoption rates climbing, costs trending down).
Realized ROI: financial results confirmed over a full cycle (revenues up, costs down).
Capability ROI: value of infrastructure built (data pipeline, models, trained staff) which will pay off in the future.
For Scrum Masters and POs, emphasize quick wins first (small, high-impact use cases) but plan for long-term scaling. Document assumptions (e.g. user adoption curve) and revisit them. Gartner research shows many AI projects stall because ROI was overestimated or not tracked properly.
Quick ROI Tips: One important consideration can be, “Name the outcome before you name the technology.” Every AI initiative should start with an outcome, baseline, and numeric target. Also, involve finance early so they agree on the attribution plan. Show both operations and finance angles (hours + dollars) as different slices of the same benefit.
Change Management and Adoption Strategies
Even a technically successful AI tool fails if people don’t use it. Strategies to drive adoption:
Executive Sponsorship: Secure leaders who advocate the AI (they set priorities and encourage adoption). Align the AI project with key business initiatives so it’s taken seriously.
Communication and Training: Explain “what’s in it for me” to end-users. Provide hands-on training sessions, documentation and quick reference guides. IBM emphasizes upskilling (AI literacy) and involving employees early. Launch pilot programs (hackathons, champions) and collect feedback.
Iterative Rollout: Start small (e.g. one team or region), measure adoption, refine, then scale. This reduces risks and builds success stories. Use success stories to convince others.
Metrics and Incentives: If possible, include AI usage or outcomes in performance metrics. For example, set a team OKR to “increase AI tool usage by 50%” or incentivize improvement in relevant KPI. We need to note that lack of adoption yields zero ROI – a useful caution to share.
Change Management Framework: Consider formal change management (e.g. ADKAR). Build trust by being transparent about how AI affects roles. As IBM notes, address employees’ fears (job impact) by focusing on augmenting skills and explaining long-term goals.
Iterate and Support: Maintain a feedback loop. If users report issues, fix them quickly. Highlight early improvements publicly. Quarterly reviews help adjust the baseline as the system evolves.
Tooling and Vendor Options
Many tools support measuring and managing AI improvements. Examples:
Data & MLOps Platforms: Open-source: MLflow (tracking experiments, models), Kubeflow (pipelines), Tensor Board (model metrics). Commercial: Data Robot, Databricks, AWS Sage Maker, Azure ML, Google Vertex AI – these provide end-to-end ML lifecycle management and built-in monitoring. They can auto-log model performance and lineage.
Monitoring and Observability: Tools like Arize, Fiddler, Evidently, or open-source Prometheus/Grafana can track model accuracy, drift, feature distribution, latency, etc. Model monitoring platforms often include alerting for anomalies (e.g. sudden drop in accuracy or spike in data skew).
Business Analytics/Reporting: Use BI tools like Tableau, PowerBI, or open-source Apache Superset to build dashboards. For OKRs/KPIs specifically, platforms like Gtmhub, Betterworks or even Jira Align can track OKRs with live data. Google Analytics or Mix panel can handle web metrics (for recommendation/marketing use-cases).
Experimentation Frameworks: Tools like Optimizely, Launch Darkly, or built-in A/B frameworks (e.g. Kubernetes experiments, Ramp experiments) help manage controlled experiments. For causal analysis, libraries like Facebook’s Causal Impact or Do Why (Python) can assist.
AI Governance: Platforms for explainability and governance (IBM Watson OpenScale, Google AI Explanations, H2O Driverless AI) help monitor fairness and compliance. They can compute fairness metrics, track lineage, and enforce policies.
Infrastructure: Cloud providers offer managed services (AWS Sage maker Clarify for bias, Azure ML Insights, etc.) that tie into the tools above. Open-source choices include Docker/Kubernetes for deployment, and Kafka for data streaming.
Vendor Solutions: Sometimes vendors provide proprietary ROI analysis services (e.g. Forrester TEI studies). While expensive, a Forrester or IDC study like the IBM one can lend credibility.
In the table below, we compare some high-level frameworks and tools for measurement:
Category | Example | Use-case | Notes |
Goal-setting | OKR Framework (e.g. Gtmhub) | Align AI projects with objectives, cascade goals | Ensures transparency, focus on outcomes |
Performance Dashboard | Tableau/PowerBI | Build custom dashboards of KPIs, trends | Flexible visual analytics |
ML Tracking/Experiment | MLflow, Kubeflow | Log model experiments, manage pipelines | Open-source; foundational MLOps |
Model Monitoring | Arize, Fiddler, Evidently | Track model drift, accuracy, AI ops metrics | Specialized for AI metrics |
Attribution Analysis | CausalImpact (Google), Amplitude | Analyze A/B, lift and causal impact | For online experiments and analytics |
BI/OKR Tools | Jira Align, Azure DevOps, Worklytics | Scorecards, adoption dashboards | Built-in OKR/KPI tracking |
A/B Testing | Optimizely, LaunchDarkly | Split testing for features (web/app-based AI) | Ensures valid comparisons |
Governance | IBM OpenScale, Google Explainable AI | Monitor fairness, bias, model interpretability | Helps mitigate ethical risks |
Cloud ML Platforms | AWS Sagemaker, Azure ML | End-to-end ML with integrated monitoring | Commercial, ease of use, includes tools |
(This table gives an overview, not exhaustive. Choose tools that fit your tech stack and data strategy.)
Legal, Ethical and Risk Mitigation Considerations
When measuring AI impact, also manage the risks:
Fairness & Bias: Even with perfect metrics, unjust bias can ruin credibility. Define fairness metrics (e.g. disparate impact ratio) upfront and monitor them. For example, in lending, ensure approval rates don’t unjustly differ by protected group. Document which fairness definition you use, as they can conflict.
Privacy & Compliance: Make sure tracking data respects privacy laws. Use anonymization or opt-in for any user-level tracking. When reporting metrics, aggregate or anonymize.
Model Risk: Some industries require model validation and audit (e.g. banking AI governance). Keep logs, version models, and monitor for drift. The checklist notes that reporting raw model calls is useless; instead, connect to business outcomes.
Transparency: Be prepared to explain any KPI changes. If an external factor (new regulation, market change) affects metrics, note that. Never claim 100% credit for AI. Inflating results will backfire.
Ethical Use: Especially with generative AI, guard against misinformation or harmful content (monitor hallucination rates). Adapt workflows so humans check critical outputs.
Involve legal and ethics teams early. Build an “AI risk log” with mitigation steps (encryption, fallback processes, human review).
Case Studies (Outcomes, KPIs, and Metrics)
Below are brief examples of AI deployments with measured results. They show before vs after improvements and how metrics were tracked:
Chatbot in Insurance (IBM Watson Assistant): For a large North American insurer, IBM’s chatbot handled 30% of Tier-1 queries on Day 1, climbing to 80% by Year 3. Forrester found this reduced support costs dramatically. Measured outcome: annual benefits of ~$23.9M vs $5.5M costs, yielding ~337% ROI over 3 years. Key KPIs were calls deflected, agent time saved, and customer satisfaction. Baseline was hundreds of thousands of calls handled manually each year. After implementation, about 1 in 3 inquiries was fully resolved by AI.
Check Fraud Detection (Global Bank, with Cognizant): A major bank used ML to flag counterfeit checks in real time. Before: 100% of checks required manual verification, costing millions annually. After: 50% drop in fraudulent checks passed, saving ~$20M/year in losses. Other KPIs: scan rate (1200 checks/sec) and average review time fell. The fraud-loss metric directly tied to the bank’s bottom line. Manual review workload also fell significantly.
Demand Forecasting (Electric Utility): A utility applied AI to forecast call volume and electricity demand (McKinsey study). Before: forecast error was ~40%. After: error fell by ~10%, saving 10–15% of staffing costs and cutting lost sales by up to 65%. KPIs were forecast accuracy and missed sales; they also tracked reduced overtime hours (valued in $). Rolling forecasts were compared to actuals and exhibited steadily lower deviations after AI.
Generative AI in Healthcare (Providence Health): Using Microsoft’s Copilot, clinicians saved 5.33 minutes per patient chart on documentation. Before: doctors spent an average of 19 min charting. After: about 14 min. They logged baseline time, then adoption (Copilot usage rate) and time-on-task. The outcome was non-financial (more physician time for patients), but Providence could monetize it by treating more patients per day. This metric (time saved) became a KPI: weekly aggregate hours saved.
Productivity in Advertising (Dentsu): At Dentsu, creative teams using AI (Copilot) saved 15–30 minutes per day on writing tasks. Before: full manual creation of ads. After: part of the process automated. KPIs tracked included daily active copilot users and minutes saved per user. In aggregate, this translated to significant labor savings (multiplied by salary rates). Though no revenue metric was given, the efficiency gain was documented, illustrating productivity metrics are valid KPIs when they convert to cost savings.
These cases share a pattern: they all defined the targeted outcome (fraud losses, support cost, throughput, time to chart, etc.), measured a baseline, then tracked how the AI changed that metric (with appropriate controls). Always tie results back to business value, e.g. dollars saved or revenue earned.
Templates for KPI/OKR Statements
Use a consistent format:
Objective (Outcome): “<Achieve X business goal>.”
Key Result (Metric): “KR1: Increase <KPI> by Y% (from A to B) by [time].”
Example: “Increase customer-ticket resolution rate by 25% (from 60% to 85%) by Q4.”
Additional KRs can be secondary metrics or targets.
For each AI project, you might define:
Objective: e.g. “Improve customer support efficiency.”
KR1: Reduce average response time to customers by 30% (from 10 min to 7 min).
KR2: Deflect 40% of Tier-1 queries to AI chat by end of year.
Objective: “Strengthen fraud prevention.”
KR1: Cut fraud losses by 50% year-over-year.
KR2: Reduce manual review costs by 20% by automating 75% of low-risk cases.
Objective: “Accelerate procurement approvals.”
KR1: Decrease purchase order cycle time from 5 days to 2 days.
KR2: Automate 60% of invoice checks with <1% error rate.
Always tie each KR to a number and timeframe. Use tables or bullet lists for clarity. Update them in sprint or quarterly reviews.
Pitfalls to Avoid (Checklist)
⚠️ Avoid measuring activities, not outcomes. Do not tout “API calls” or “models trained” as success metrics. Focus on what changed (e.g. errors prevented, costs reduced).
⚠️ No baseline: Never skip documenting the pre-AI state. Without it, you can’t calculate real ROI. Ensure all projects have a validated baseline measurement before launch.
⚠️ Ignoring full TCO: Include all costs (infrastructure, maintenance, human review). Missing these leads to overstated ROI. List costs like GPU time, cloud usage, and retraining cycles.
⚠️ Oversimplifying attribution: Be honest about what other changes might affect the outcome. Report any uncertainties. Overclaiming destroys credibility.
⚠️ Low adoption: An unused tool delivers no value. Track user adoption (active users, usage depth). If adoption stalls, investigate (training/gap) rather than tweaking the model.
⚠️ One-size-fits-all metrics: Don’t copy KPIs from other teams without analysis. Involve finance/ops in KPI selection to ensure metrics are meaningful and will be funded.
⚠️ Stale metrics: AI systems drift. Re-calibrate baselines and targets at least quarterly. A baseline that was accurate at launch may mislead later.
Overcoming obstacles: Address common gaps:
Tools gap: Start with accessible tools (Excel, standard BI) if advanced platforms aren’t in place. Many measurements (e.g. time saved, counts) can be done in spreadsheets or simple databases. Gradually adopt MLOps/monitoring as needed.
Skills gap: Upskill product teams in analytics. Pair data scientists with domain experts. Use pre-built frameworks (e.g. Google’s AI KPI playbooks or McKinsey infographics) to train stakeholders on metrics.
Data gap: If clean data is lacking, focus first on improving data quality. Sometimes manual sampling or a smaller pilot project helps prove the case before full-scale implementation.
Adoption gap: Engage a change agent or scrum master to shepherd adoption. If adoption is low, use user interviews to uncover blockers and address them (lack of training, unclear value).
ROI proof gap: Present both qualitative wins (like “faster decision-making”) and quantitative data. Use ranges if uncertain (“expected 10–20% lift”). Transparency about uncertainty builds trust more than unfounded precision.
Finally, maintain an AI ROI dashboard : it should answer “Is the system working? Is it giving return? Are people using it?”.
Conclusion: Showing tangible AI improvements means rigorous alignment between technology and business metrics. Define outcomes first, then choose KPIs/OKRs, measure carefully, report clearly, and adjust swiftly. By following these practices and learning from real case studies, agile teams can make AI gains visible and repeatable.
Sources: Authoritative guides and case studies were used throughout, including Atlassian (OKR definitions), McKinsey (forecasting impact), IBM/Forrester (chatbot ROI), Cognizant (fraud case), Microsoft case data, Worklytics (adoption KPIs), agility-at-scale (ROI frameworks), Straive (KPIs and pitfalls), and Xebia/IBM (change management best practices). These together inform a comprehensive, actionable measurement strategy.


Comments